Overview
The KubeNidra Agent is the core Kubernetes operator that manages workload hibernation in your cluster. It's a Go-based application that watches multiple workload types across Namespaces and intelligently scales them to zero when idle. Workloads can also have a configurable schedule for staying in active state.
The agent uses annotations to decide whether a workload should be acted upon or not. If you want a workload to be managed by KubeNidra agent, simply add kubenidra/enabled=true annotation to it.
Architecture
The agent follows a modular architecture with several key components:
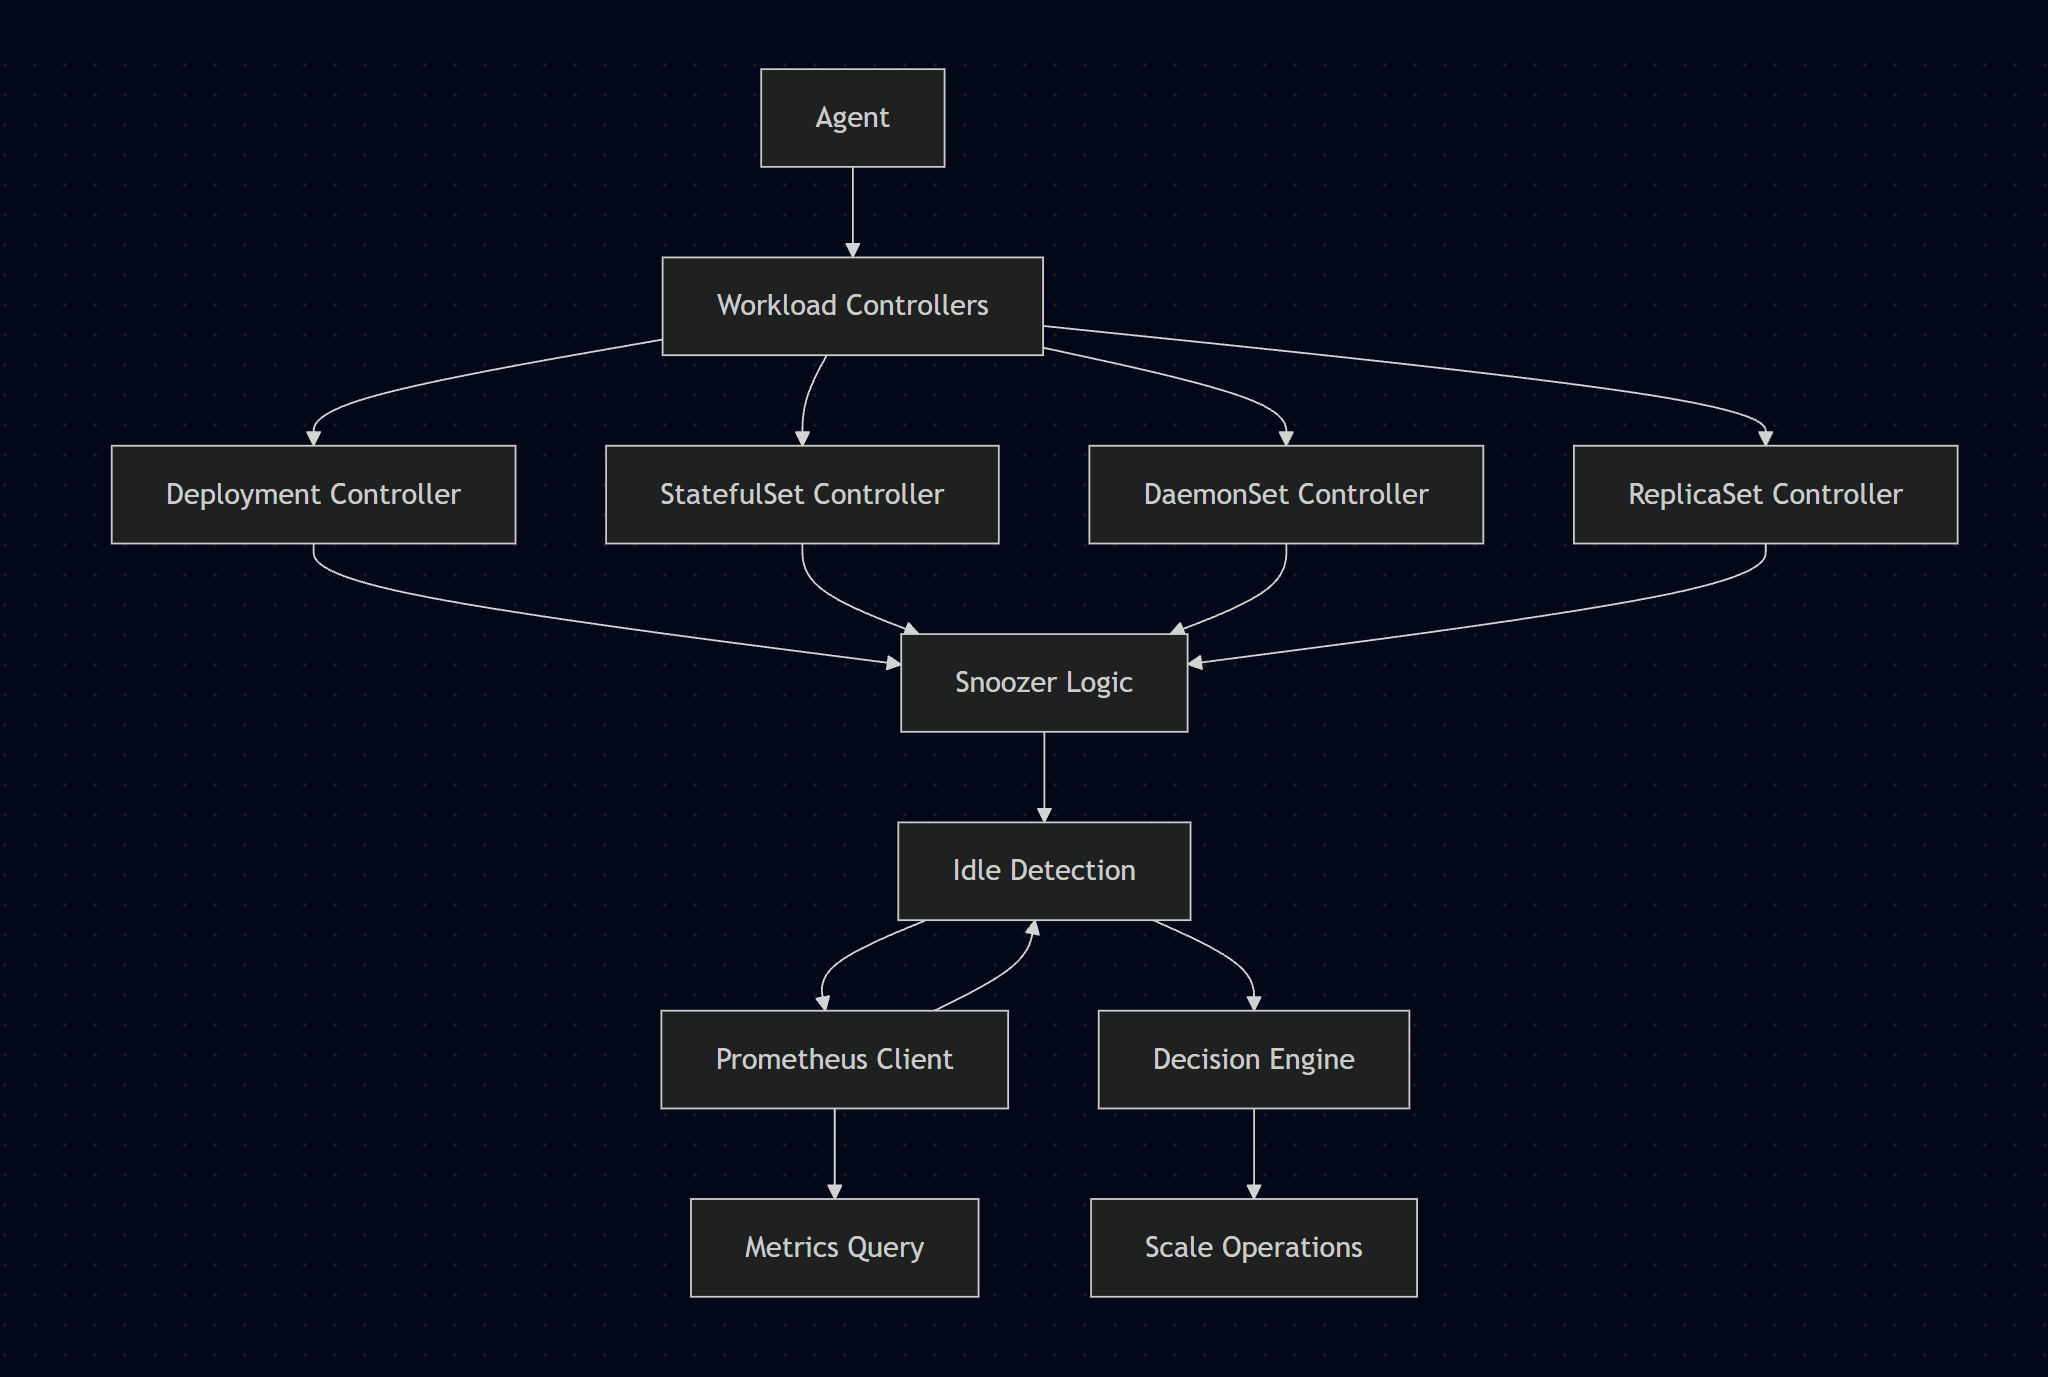
Core Components
1. Workload Controllers
The agent runs separate controllers for each workload type:
- DaemonSet Controller: Manages DaemonSets
- Deployment Controller: Manages Deployments
- ReplicaSet Controller: Manages ReplicaSets
- StatefulSet Controller: Manages StatefulSets
Each controller uses Kubernetes informers to watch for changes and maintains a local cache of workload states.
2. Snoozer Logic
The core decision engine that determines when workloads should be snoozed or woken:
- Idle Detection: Analyzes Prometheus metrics for CPU/memory usage
- Schedule Management: Handles wake-up schedules
- State Preservation: Stores original replica counts
- Smart Automation: Implements backoff and rate limiting
3. Prometheus Integration
Queries Prometheus for container metrics:
- CPU usage per container
- Memory usage per container
- Pod-level aggregation over time windows
- Metrics validation for data quality
4. HTTP Server
Provides health and monitoring endpoints:
- Health Check:
/healthz- Liveness and readiness - Metrics:
/metrics- Prometheus-formatted metrics
Configuration
Agent Configuration
The agent uses a YAML configuration file with the following structure:
log_level: "info" # Log level: debug, info, warn, error
server:
  port: 8118

prometheus:
  endpoint: "http://prometheus-kube-prometheus-prometheus.kubenidra:9090"
  timeout: "10s"

watched_namespaces: # Namespaces to watch for workloads. Blank means all namespaces.
  - "development"
  - "staging"
  - "test"

snooze:
  # CPU threshold for considering a workload idle (in cores)
  cpu_threshold: 0.01
  # Memory threshold for considering a workload idle (in bytes)
  memory_threshold: 52428800 # 50MB in bytes
  # Duration to check for idleness
  idle_duration: "10m" # How long to check for idleness
  # How often to check workloads
  check_interval: "5m"
  # How often to check for wake conditions
  wake_check_interval: "1m"
  # Grace period after manual wake before allowing automated snoozing
  wake_grace_period: "30m"
  # Minimum time between operations to prevent flapping
  operation_cooldown: "5m"
  # Behavior mode: aggressive, conservative, or manual
  behavior_mode: "aggressive"

  # Smart Automation settings
  # Maximum operations per hour before applying backoff
  max_operations_per_hour: 10
  # Number of operations to track in history
  operation_history_limit: 50
  # Multiplier for progressive backoff
  backoff_multiplier: 2.0
  # Maximum backoff duration
  max_backoff_duration: "1h"

  # Metrics Validation settings
  # Minimum time workload must run before snoozing
  minimum_running_duration: "10m"
  # Minimum percentage of time window with data. e.g. 70% of 10m is 7 (At least 7 minutes of data)
  minimum_data_coverage: 0.7
  # Minimum number of data points required (At least 5 (minutes) data points)
  minimum_data_points: 5
  # Enable metrics validation
  prometheus_validation_enabled: true
  # Extra grace for new workloads
  new_workload_grace_period: "10m"
Behavior Modes
The agent supports three behavior modes:
- Aggressive: Default mode, actively snoozes idle workloads
- Conservative: More cautious, requires longer idle periods
- Manual: Only snoozes on explicit requests
Idle Detection Logic
The agent uses sophisticated logic to determine if a workload should be snoozed:
1. Basic Checks
- KubeNidra enabled annotation (
kubenidra/enabled: "true") - Not already snoozed (replicas > 0)
- Not pinned in current state
- Manual snooze requested (
kubenidra/snooze-now: "true") - Not under manual override
- No operation in progress
2. Manual Overrides
- Check for manual override annotations
- Respect time-based overrides
- Honor permanent overrides
3. Schedule Validation
- Check if within wake schedule
- Validate schedule format
- Handle multiple time ranges
4. Grace Periods
- Check wake grace period after manual wake
- Check operation cooldown period
- Respect new workload grace period
5. Metrics Validation
- Ensure sufficient Prometheus data coverage
- Validate minimum data points
- Check minimum running duration
- Verify data quality thresholds
6. Smart Automation
- Check operation rate limits
- Apply backoff if too many operations
- Track operation history
- Implement progressive backoff
Wake Logic
The agent wakes workloads when:
- Manual wake requested:
kubenidra/wake-now: "true" - Within wake schedule: Current time matches schedule
- Grace period expired: After manual wake grace period
- Override cleared: Manual override removed
Annotations
The agent uses several annotations to manage workload state:
metadata:
  annotations:
    # Enable KubeNidra
    kubenidra/enabled: "true"

    # Wake schedule 09:00-17:00,mon-wed,fri;08:00-18:00,thu;22:00-03:00,fri-mon
    kubenidra/wake-schedule: "09:00-17:00,mon-fri"

    # Manual requests
    kubenidra/snooze-now: "true"
    kubenidra/wake-now: "true"

    # State preservation
    kubenidra/last-replicas: "3"
    kubenidra/snoozed-at: "2024-01-15T10:30:00Z"
    kubenidra/woken-at: "2024-01-15T10:00:00Z"

    # Manual overrides
    kubenidra/manual-override: "true"
    kubenidra/manual-override-until: "2024-01-15T12:00:00Z"

    # Pin state
    kubenidra/pin-state: "active" # or "snoozed"

    # Operation tracking
    kubenidra/operation-in-progress: "snooze"
    kubenidra/backoff-until: "2024-01-15T11:00:00Z"

    kubenidra/last-operation-at: "2024-01-15T10:00:00Z"
    kubenidra/last-operation-type: "snooze"
    kubenidra/operation-history: "" # JSON encoded string storing operation history
    kubenidra/operation-count: "" # JSON encoded hourly operation counters to determine backoff
Monitoring
Health Checks
# Health check
curl http://kubenidra-agent:1881/healthz

# Metrics endpoint
curl http://kubenidra-agent:1881/metrics
Metrics [To be Implemented]
Prometheus metrics exposed on /metrics:
kubenidra_workloads_total- Total workloads being monitoredkubenidra_snoozed_workloads- Currently snoozed workloadskubenidra_operations_total- Total snooze/wake operationskubenidra_operation_duration_seconds- Operation durationkubenidra_prometheus_queries_total- Prometheus query count
Logs
Structured logging in JSON format:
{
  "level": "info",
  "ts": 1754407069.6157837,
  "caller": "controller/workloads.go:207",
  "msg": "Should be snoozed",
  "workloadType": "deployment",
  "namespace": "development",
  "name": "multi-pool-alpine"
}
{
  "level": "info",
  "ts": 1754407069.6158242,
  "caller": "snoozer/logic.go:143",
  "msg": "Snoozing",
  "workloadType": "deployment",
  "namespace": "development",
  "name": "multi-pool-alpine",
  "current_replicas": 2
}
{
  "level": "info",
  "ts": 1754407070.3216362,
  "caller": "snoozer/logic.go:456",
  "msg": "Successfully added operation to history",
  "workloadType": "deployment",
  "namespace": "development",
  "name": "multi-pool-alpine",
  "operation": "snooze",
  "trigger": "auto",
  "replicas": 2
}
{
  "level": "info",
  "ts": 1754407070.3217025,
  "caller": "snoozer/logic.go:189",
  "msg": "Successfully snoozed",
  "workloadType": "deployment",
  "namespace": "development",
  "name": "multi-pool-alpine",
  "saved_replicas": 2,
  "trigger": "auto"
}
RBAC Requirements
The agent requires the following permissions:
apiVersion: rbac.authorization.k8s.io/v1
kind: ClusterRole
metadata:
  name: kubenidra-agent
rules:
  - apiGroups: ["apps"]
    resources: ["daemonsets"]
    verbs: ["get", "list", "watch", "update", "patch"]
  - apiGroups: ["apps"]
    resources: ["deployments"]
    verbs: ["get", "list", "watch", "update", "patch"]
  - apiGroups: ["apps"]
    resources: ["replicasets"]
    verbs: ["get", "list", "watch", "update", "patch"]
  - apiGroups: ["apps"]
    resources: ["statefulsets"]
    verbs: ["get", "list", "watch", "update", "patch"]
Troubleshooting
Common Issues
-
Prometheus connection failed
- Check Prometheus endpoint configuration
- Verify network connectivity
- Check Prometheus service discovery
-
Workload not being snoozed
- Verify
kubenidra/enabled: "true"annotation - Check namespace is in watched list
- Review CPU/Memory thresholds
- Check for manual overrides
- Check for pinned state
- Verify
-
Wake-up not working
- Check schedule format:
"09:00-17:00,mon-fri" - Check manual wake annotation
- Check schedule format:
-
Too many operations
- Check operation rate limits
- Review backoff configuration
- Check operation history
Debug Mode
Enable debug logging:
# Logging
log_level: "debug"

# Namespaces to watch
watched_namespaces:
  - "development"
  - "staging"
  - "test"
Logs
# Check agent logs for validation errors
kubectl logs -n kubenidra -f -l kubenidra/component=agent
Development
Building
Local setup uses ./config/agent.yaml configuration file.
# Run locally
make run-agent
Testing
# Run tests
make test

# Run with coverage
make test-coverage

# Run specific test
go test ./pkg/snoozer/...
Docker
# Build image
make docker-build

# Push to registry
make docker-push
Local Kubernetes Deployment
# Deploy
make deploy

# Load images in Kind cluster
make kind-load